
Every conflict signal on one screen
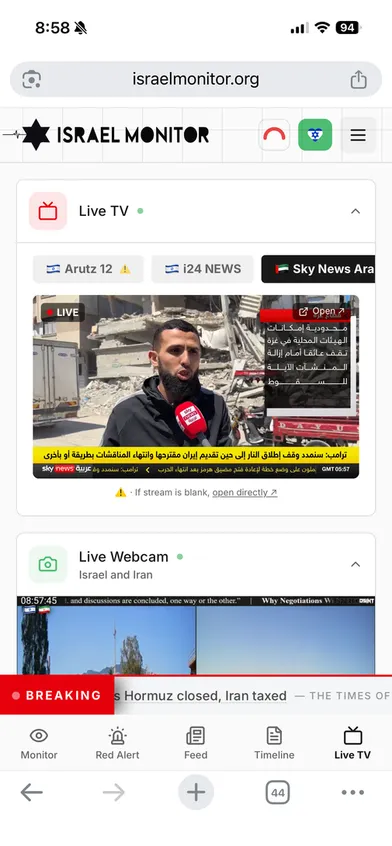
During escalation the fastest signals are scattered across Telegram channels, Twitter accounts, and live broadcasts. Israel Monitor pulls them into a single interface — live feeds, a tactical map, and an editorial timeline — so you can follow events as they unfold without chasing fifteen tabs.
EARLY USAGE SIGNALS
- 18Live data sources
- 70+Monitored accounts
- 3m 13sAvg. visit duration
PROBLEM
No single place to understand what was happening, right now
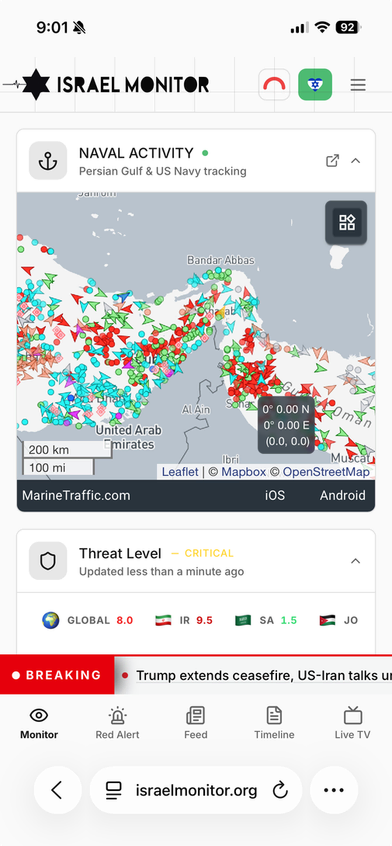
When the conflict escalated, the information problem was not scarcity but fragmentation. News lagged. Social feeds were immediate but noisy. Telegram was fast and often essential, but difficult to follow, especially across languages and source quality. What was missing was not just more information, but a better interface for urgency: one place that could combine alerts, context, and live signals without forcing people to assemble the picture themselves. Israel Monitor was built to make that picture legible.
CHALLENGES
Designing against unstable inputs
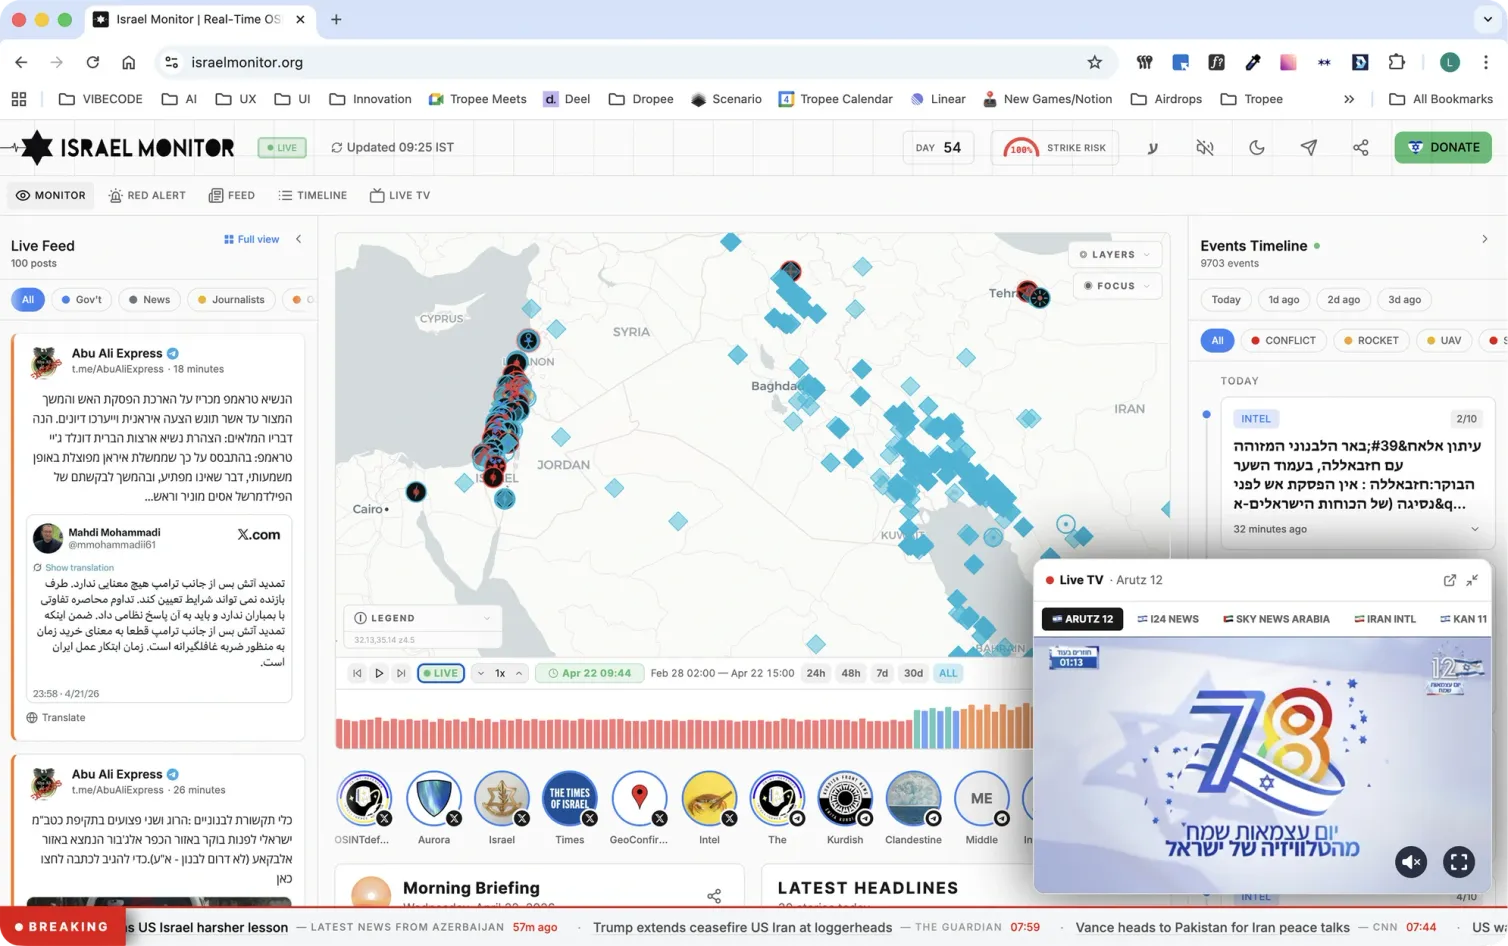
This was never a clean-data product. The fastest sources — Telegram channels, Twitter accounts — were also the least reliable: feeds broke without warning, events arrived duplicated or half-translated, and quality varied wildly by channel and language. I couldn't verify most of it, and pretending otherwise would have been dishonest — so the design job became keeping provenance visible instead, with source, channel, and timestamp attached to every signal so readers could judge for themselves.
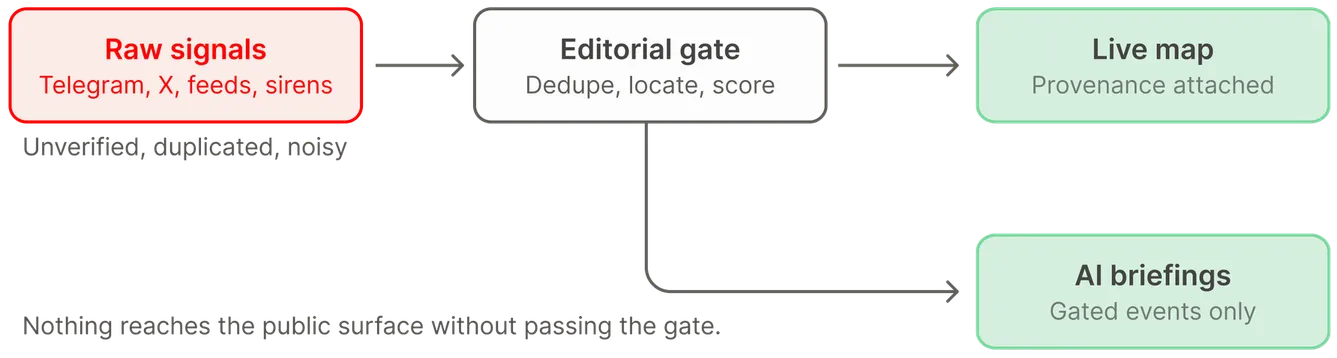
Behind that sat an editorial problem: not everything that came in was ready to publish, which meant building an internal gate for deduplication, location fixes, and confidence scoring before anything reached the live map. And all of it had to stay readable during actual escalation — the moment users needed the product most was exactly when the inputs were noisiest, so the interface had to decide what was worth surfacing rather than simply showing more.
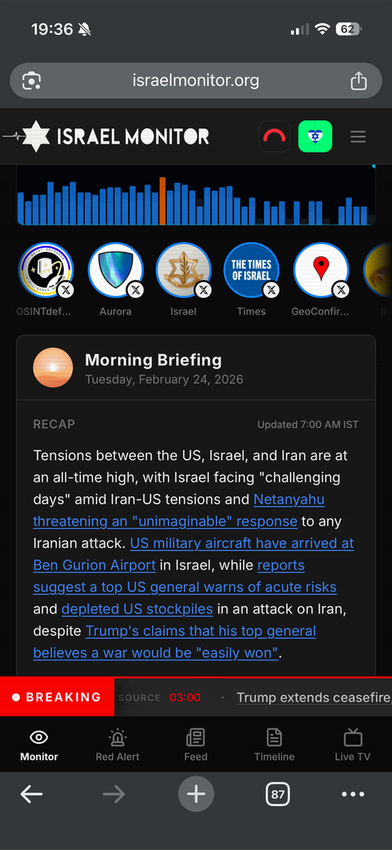
The AI briefings sharpened the same problem: a model summarizing unverified live inputs can state noise as fact, so briefings drew only from events that had passed the editorial gate, and stayed conservative by design.
BUILD
Built solo, end to end
There was no engineering team. I designed, built, and shipped Israel Monitor myself, using AI-assisted development (Lovable) to move from interface work into relay logic, cron jobs, feed parsing, automation, and live data orchestration.
Working this way meant owning decisions I would normally hand off — how data arrived, how often, what happened when a feed broke. That changed the design: I couldn't specify a real-time system without also being responsible for whether it stayed up. It ran under live escalation with real traffic, unstable inputs, and continuous iteration while events were still developing.
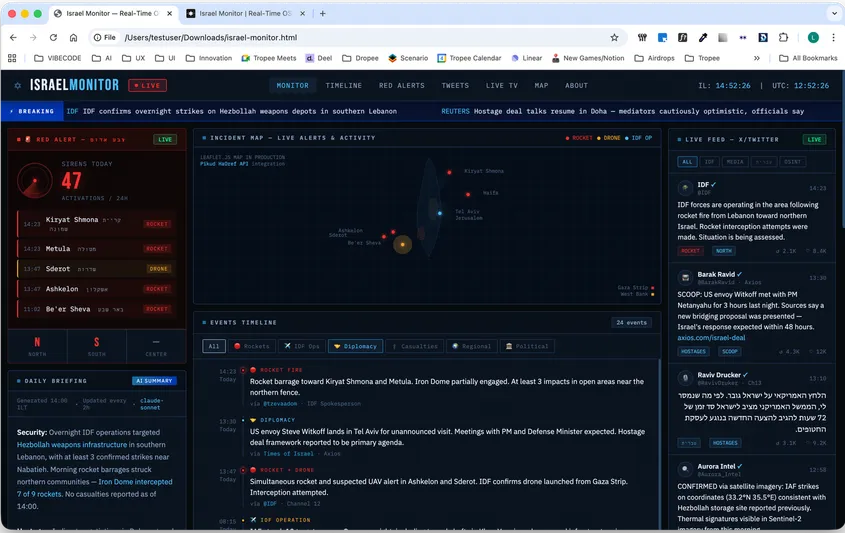
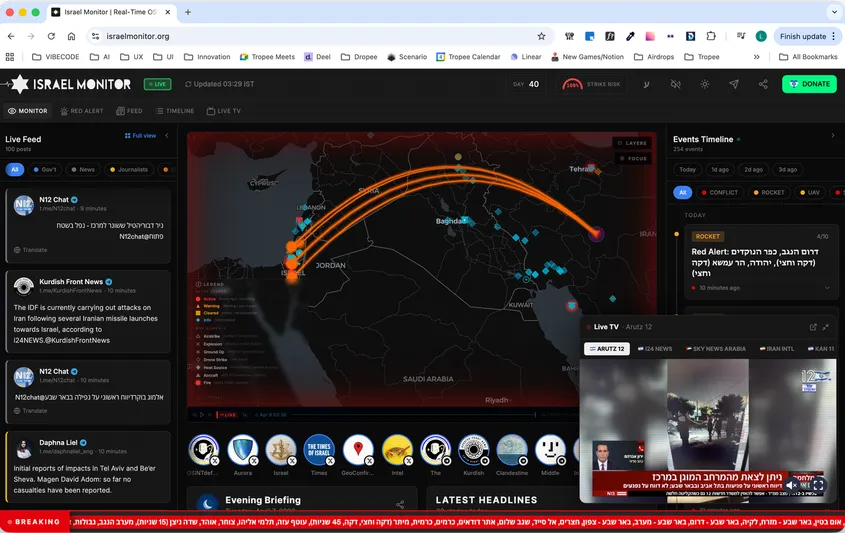
The product evolved from a modular dashboard into a more focused operational interface.
EVOLUTION
From feeds to spatial awareness
As the product matured, the limitation of a feed-based interface became clear: it could show that something happened, but not where signals concentrated, how threats were moving, or how events related across the region.
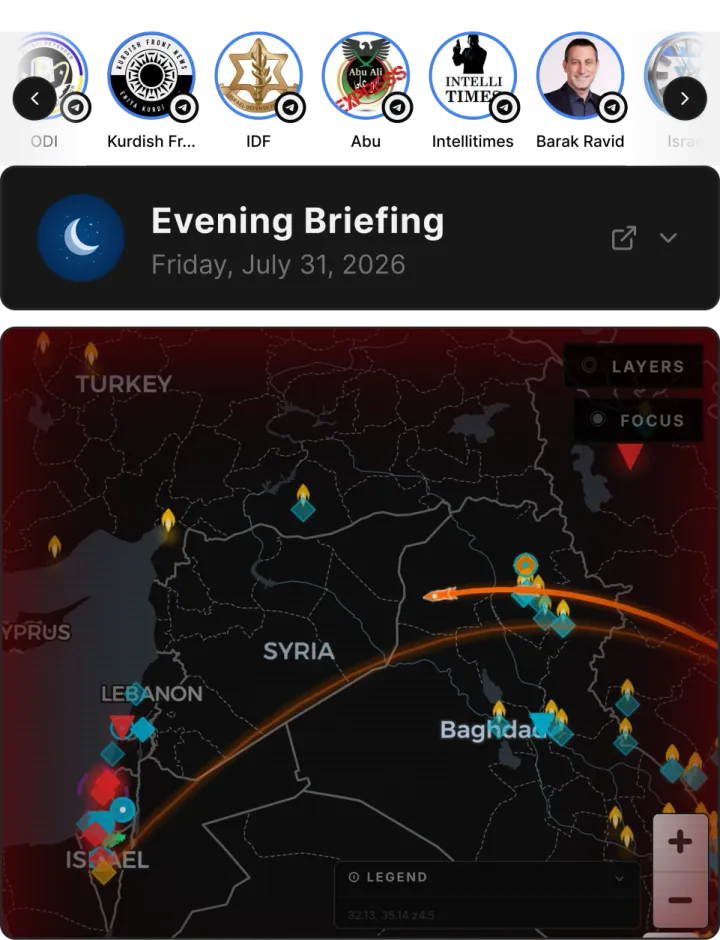
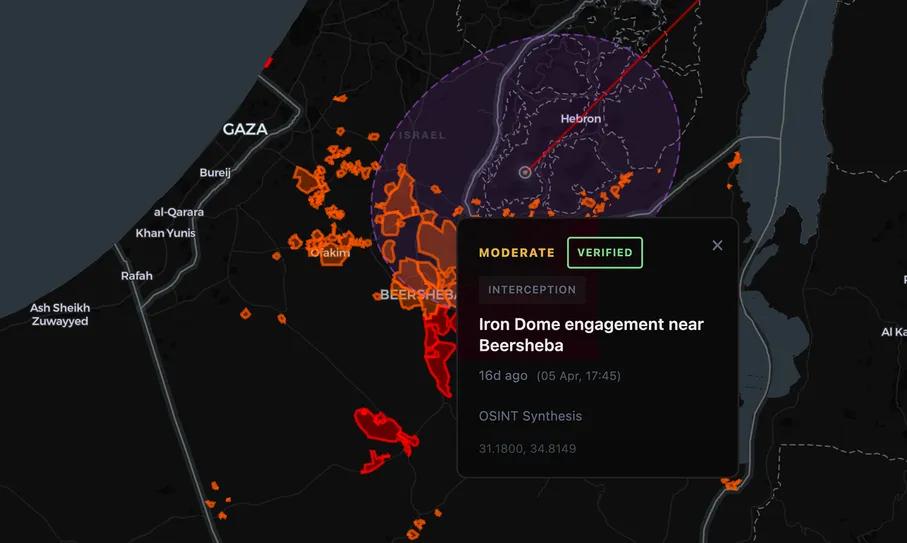
I redesigned the experience around a tactical map layer. Alerts, trajectories, and event markers could now be interpreted in geographic context rather than as disconnected updates — shifting the product from passive monitoring to real situational awareness. A later replay-oriented “Time Machine” extended this further, turning the map into both a live interface and a historical record of escalation over time.
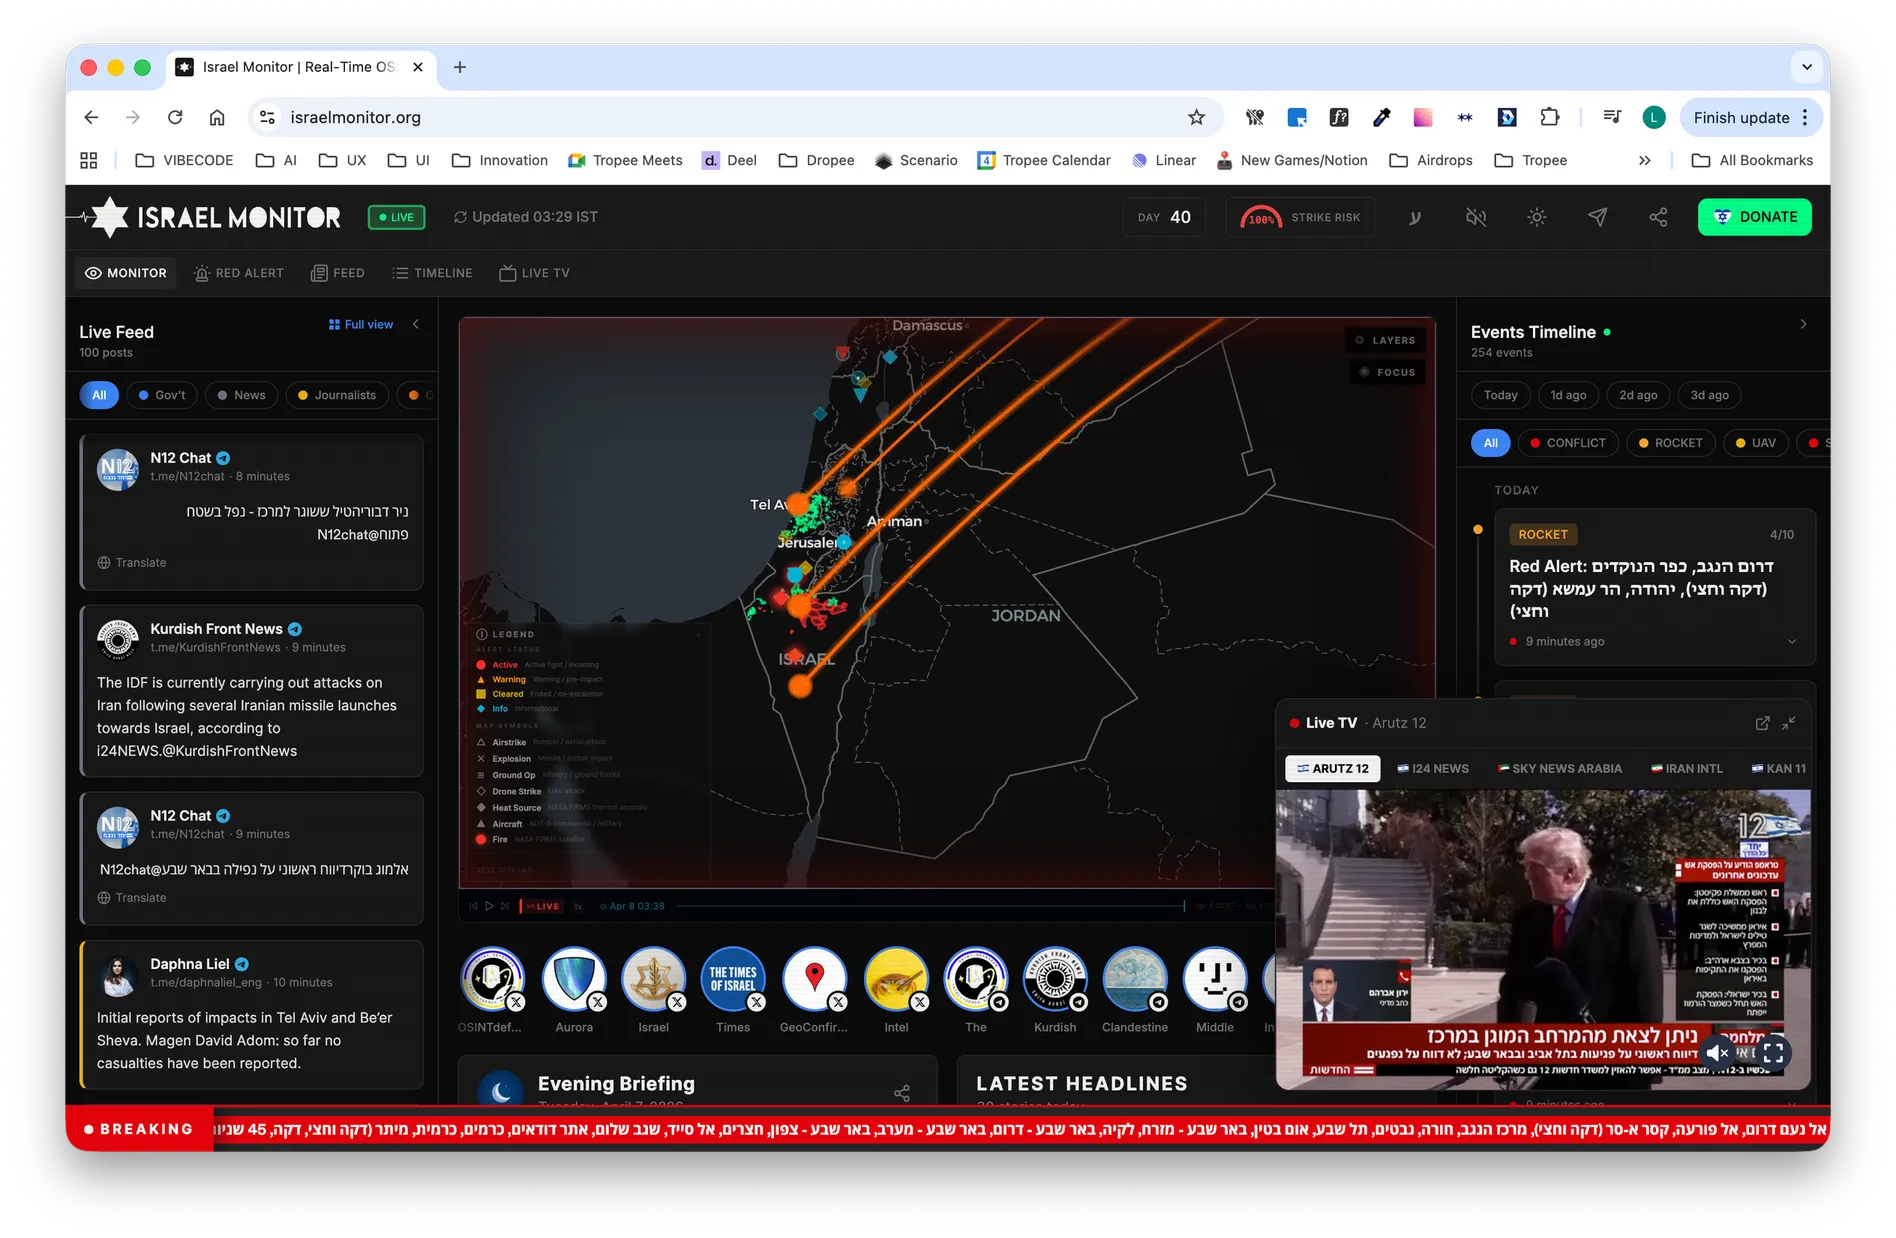
Regional view for movement across theaters
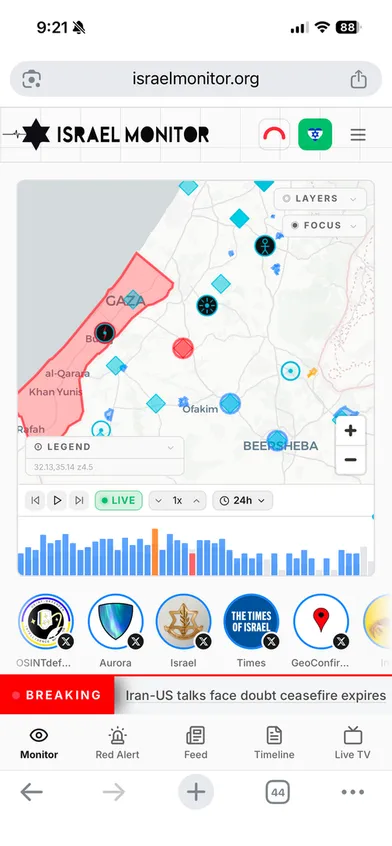
Local view for immediate operational clarity
TRUST
Designing the system behind the system
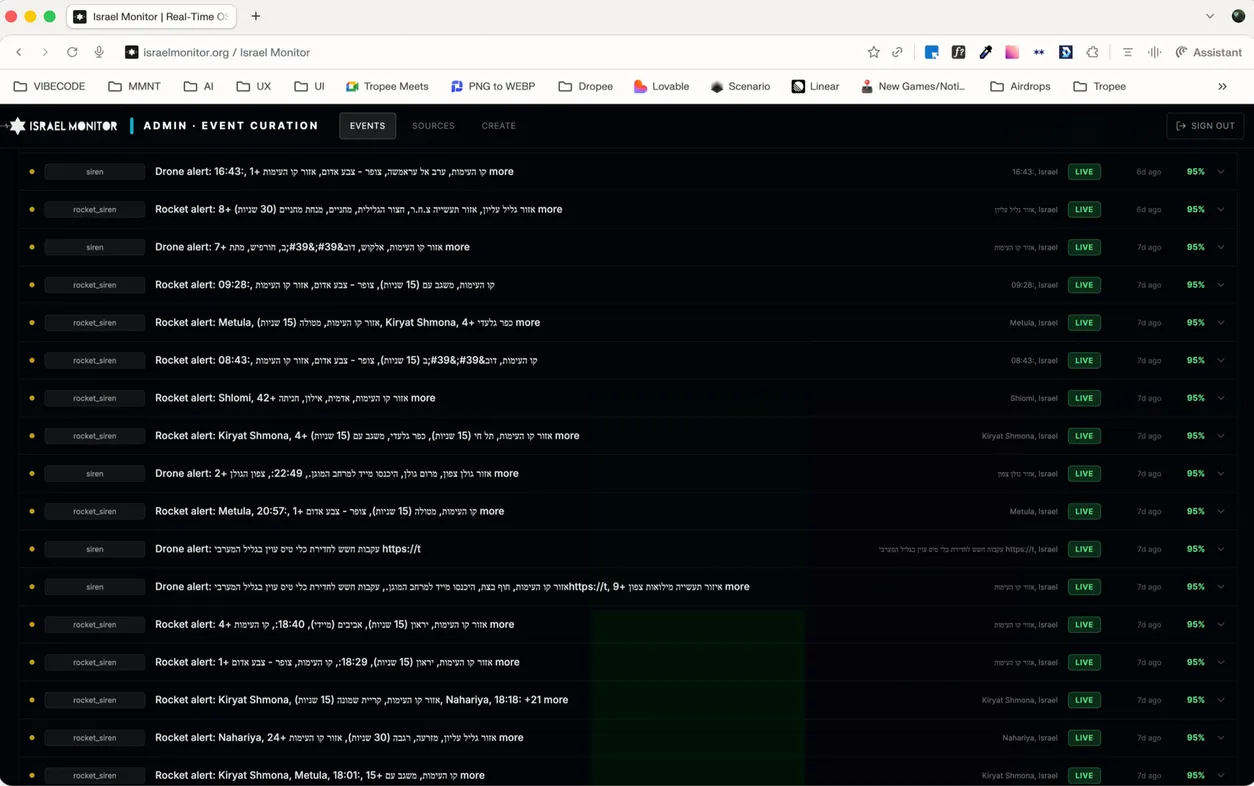
A real-time map is only as useful as the quality of the events behind it. As more sources were added — Telegram channels, alerts, extracted reports — the product needed more than a front-end. It needed operational control over what became visible, when, and with what level of confidence.
I designed an internal workflow for reviewing, structuring, and publishing events. This layer handled deduplication, location fixes, confidence scoring, and publication state — turning noisy, incoming data into a coherent public surface.
This wasn’t just a backend concern. It was essential to keeping the live experience fast, credible, and usable under pressure.
DISTRIBUTION
Designed for the surface people actually use
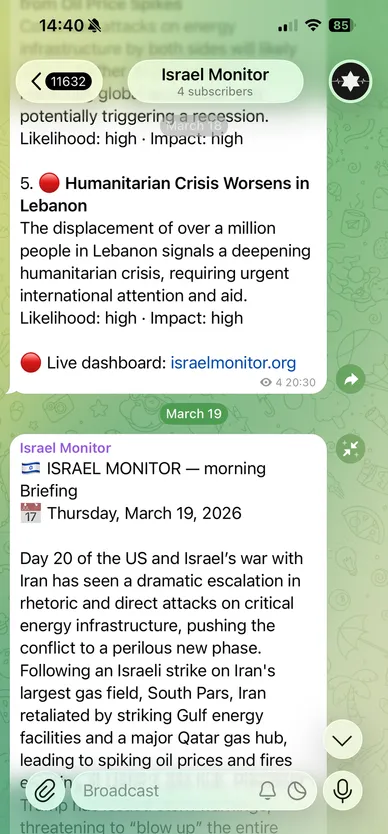
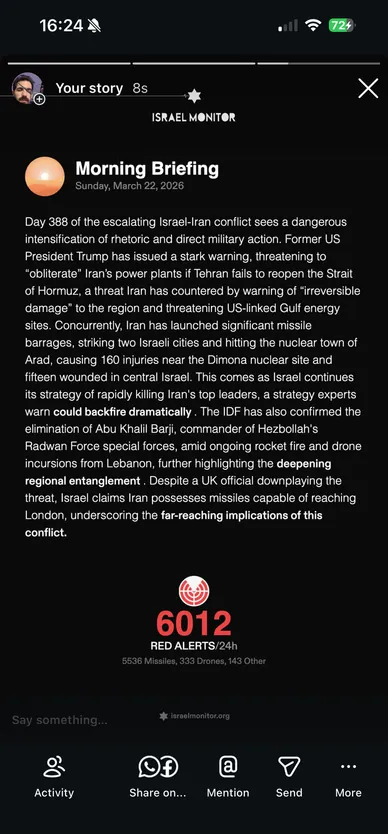
The system was not limited to a single interface. The same intelligence powered multiple surfaces: a dense desktop dashboard, Telegram updates, mobile alert views, and lightweight AI briefings.
Different contexts demanded different speeds. Some users needed a full operational view, others a quick check-in or a shareable summary. Designing the product meant designing how the same signals adapted across those moments without losing clarity or meaning.
OUTCOME
Shipped under live conditions
Israel Monitor launched publicly and was used during active escalation periods. In its first months, it drew repeat traffic, meaningful session time, and sustained usage — indicating that people were not just visiting, but relying on it to follow events as they unfolded.
Traffic came from multiple countries and skewed slightly mobile, reinforcing the need to design beyond a desktop dashboard and support faster, lighter consumption surfaces.
The system I designed held up under real conditions — supporting sustained usage during live escalation and enabling users to follow events as they unfolded, not just after the fact.
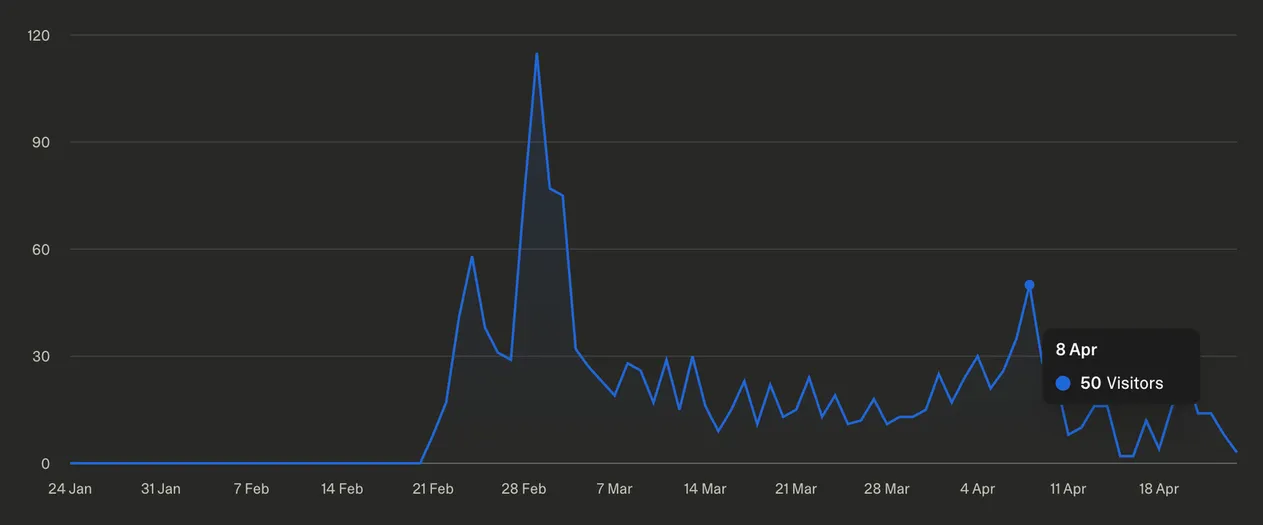
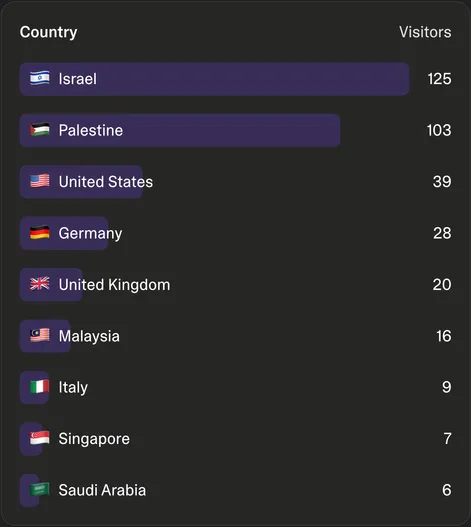
Sustained repeat traffic and 3+ minute average sessions during active escalation — visitors returning to follow events live, not just checking in once.
View ProductI design systems, not just screens—products that stay clear under real-world use.